G.plot()
Description:
Compute the chart plotting string and its parameters, plot them onto the canvas, and return a chart element.
Syntax:
G.plot(e,ai:xi:Ai,…)
Note:
The function computes the plotting string on the canvas G to plot the chart element e; and assigns the chart element parameter ai with the value xi. If the corresponding coordinate axis is available for this parameter value, then this coordinate axis is Ai. The text element, when certain properties are present, can be used to generated two-dimensional code.
Parameter:
|
G |
Canvas |
|
e |
Chart element, for example, MapAxis, NumericAxis, EnumAxis, DateAxis, BackGround, Column, Line, Dot, Polygon, Text, Legend and Sector. |
|
ai |
Parameters of chart element, for example, the name, logicData, and physicalData parameters in the chart element of MapAxis. For more details, please refer to sections about chart element parameters. |
|
xi |
Parameter value |
|
Ai |
Coordinate axis corresponding to the parameter value |
Return value:
Chart element
Example:
|
|
A |
|
|
1 |
[Apple,Banana,Peach,Strawberry] |
|
|
2 |
=canvas() |
|
|
3 |
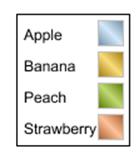
=A2.plot("Legend","legendText":A1,"x":0.81,"y":0.2,"width":0.18) |
Draw legend. |
|
4 |
=A2.draw(500,200) |
View the legend.
|
|
5 |
=canvas() |
|
|
6 |
=A5.plot("Text","text":"hello word!","width":200,"height":200,"barType":256,"data1":250,"data2":250) |
Generate two-dimensional code using the text element. |
|
7 |
=A5.draw(200,200) |
Return a canvas with both width and height being 200 pixels; click Chart plotting under the Value column or right-click the current cell to select Chart plotting to generate the following two-dimensional code.
|