Report properties
Through this item, you can set global properties for a report.
Click Report -> Report properties, or select primary cell of the report and click right-click menu -> Report properties, or press Ctrl+B to get into “Report Properties” interface, where you can switch between General, Print, Page Break, Export, Background and Subreport to configure related report properties. Below is “Report Properties” interface:

General
Click “General” tab on “Report Properties” interface to configure the report’s basic properties, as shown below:

Big dataset name
When trying to compute a huge volume of data, we can select the Big dataset name for a data set. Only Simple SQL, Script dataset and Esproc are supported.
Note: A big report can be only exported to Excel2007 for the time being.
Reporting Unit
Under “Reporting Unit”, you can select a unit for the report, millisecond, pixel and inch.
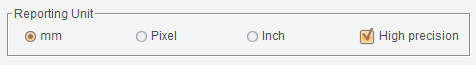
When millisecond or inch is selected, the report’s column width or row height is actually plotted in pixel. Since the result of millisecond and inch’s conversion to pixel is always rounded up, deviation becomes large when the number of columns is large, too. It is recommended that “High precision” check box is checked in this case to enable high-precision arithmetic that does not round up the result so that column width and row height will be plotted in actual pixel and errors can be avoided.
A numeric property, such as height and width under row and column properties and margin-top/margin-bottom/margin-left/margin-right properties for charts, in ReportLite is configured only by entering a number without specifying the unit. By default, they use the one configured under “Reporting Unit”.
![]()
The unit for paper-size related properties under “Report properties” is specifically specified as mm (milliseconds), so they won’t use the unit specified under “Reporting Unit”.

Max Image Size
You can specify size of an image in the report through “Max Image Size”. When an image exceeds the specified size, the system will automatically call [installation directory]\reportlite\logo\outsize.gif file to replace the original large image with it. Users can also change outsize.gif to their own image and replace an image whose size is greater than the specified one.
Display Scaling
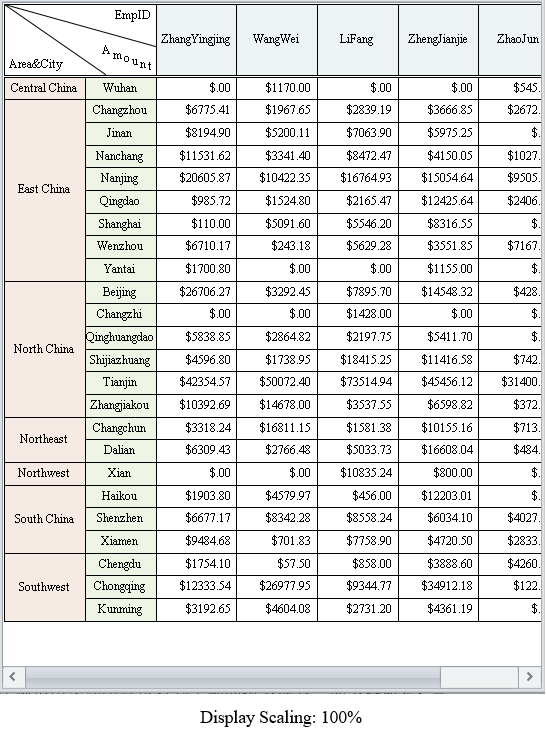
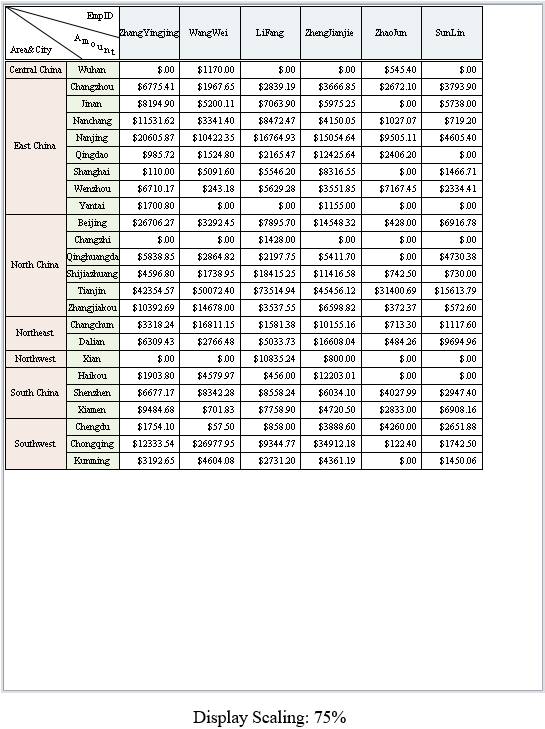
By changing value under “Display Scaling”, you can adjust the percent of displaying the target report and the report preview for convenience of viewing without changing size of the report itself. ReportLite offers several zoom options – 200%, 133%, 100%, 75% and 50%. You can set a desired display ratio through the Custom zoom setting box – “Percent”.
There is a report, for instance, you need the scrollbar to view the whole report when the report is displayed at 100% size, but you can view it wholly without the scrollbar if it is shown at 75% size, as shown below:
Cell Count
“Cell Count” specifies the estimated number of cells a report has. It is used for concurrency control by report engine on a report stored in the memory. In the report configuration file, you can set the maximum number of cells reports can have in the memory through maxCellNum and the the estimated number of cells through defaultCellNum. Before report computations, the report engine first reads the target report’s “Cell Count” property, parses the expression specified in it and computes the estimated number of cells in the target report. If “Cell Count” isn’t specified, use value of defaultCellNum as the estimated number of cells. During the concurrency computation, if sum of total number of report cells and the estimated number of cells in the current report exceeds value of maxCellNum, the report engine will delay computing the report; otherwise, it performs computations at once. The number of cells increases during the process of concurrency computation and decreases when the computation is over.
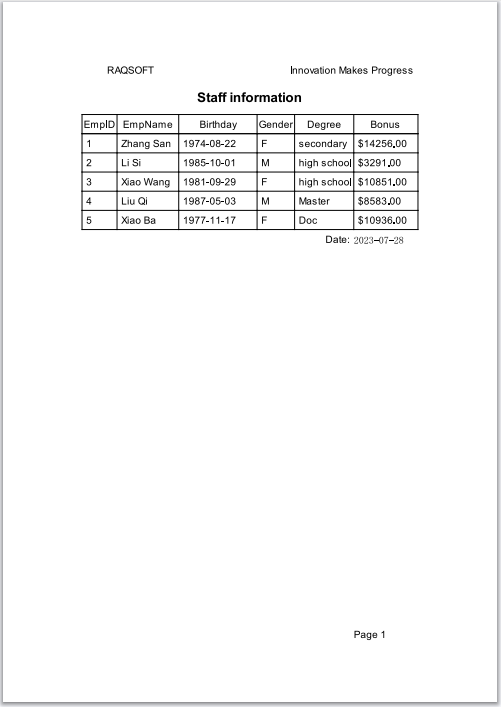
Below is a staff information report:
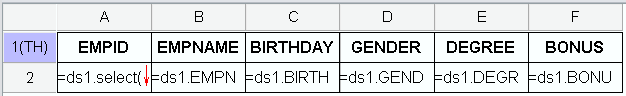
It has 6 columns and the number of rows expanded for it is ds1.count(). You can set “Cell Count” as (ds1.count()+1)*6 in “Report Properties”, as shown below:
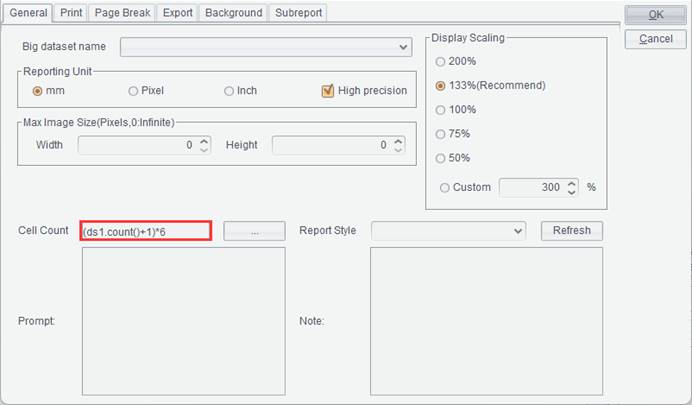
Once computations on the employee information report are finished, the number of cells it occupies is (ds1.count()+1)*6. Before report engine begins computations on employee information report, it first obtains the report’s “Cell Count” property, calculates sum of total number of cells engaging in the concurrency computation and employee information report’s “Cell Count” value, compares the summing result with maxCellNum configured in the configuration file, and delays the computation if the sum exceeds the maxCellNum value or begins the computation at once if the sum is within the limit.
●The “Cell Count” value can be an integer or an expression that does not need to be preceded by the equal sign.
Report Style
After a report style is configured under “Report Properties”, the style will be automatically listed in cell style names on the right side. Configurations of report styles can be found in reportStyleConfig.xml file in [installation directory] \reportlite\tmp.
Refresh
Refresh the report style drop-down list.
Prompt
Uses to be determined.
Note
The report maker can enter notes and descriptions here for the convenience of their or other people’s lookup.
● Example:
Take “Employee information query” report as an example, you can enter “Enter an EmpID in parameter value to query detailed information about the employee” in note edit box. Later when anyone opens the report, they will know what the report is for by checking the note.
Switch to “Print” tab in “Report Properties” interface to configure information about printing the report, as shown below:
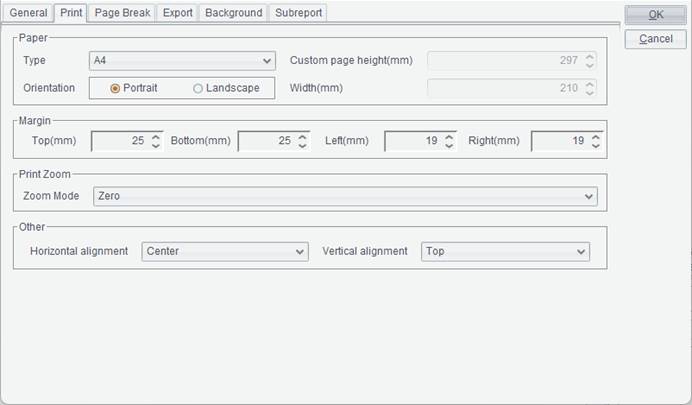
Paper Type
The paper type refers to default paper size the report uses when it is printed or exported. The property is only valid when “Page Break Mode” property value is “Page break by paper”. Except for standard paper size, ReportLite also allows users to define paper size as needed after “Custom page height” and “Custom page width”.
Size unit:
|
Paper Type |
Width (millisecond) |
Height (millisecond) |
|
A0 |
841 |
1189 |
|
A1 |
594 |
841 |
|
A2 |
420 |
594 |
|
A3 |
297 |
420 |
|
A4 |
210 |
297 |
|
A5 |
148 |
210 |
|
B0 |
1000 |
1414 |
|
B1 |
707 |
1000 |
|
B2 |
500 |
707 |
|
B3 |
353 |
500 |
|
B4 |
250 |
353 |
|
B5 |
176 |
250 |
Paper size conversion formula: (1mm×72)/25.4=1pixel
72 pixels=1inch
Orientation
Default direction of paper for print or export, including Portrait and Landscape. Default direction is Portrait. When a report is short and wide, you can set “Orientation” as “Landscape”.
Custom page height
When paper type is “Custom”, the system reads “Custom paper height” value as the height for report printing.
Custom page width
When paper type is “Custom”, the system reads “Custom paper width” value as the width for report printing.
Margin
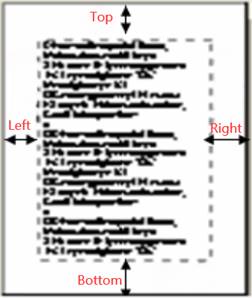
Top: Default top margin for report print or export.
Bottom: Default bottom margin for report print or export.
Left: Default left margin for report print or export.
Right: Default right margin for report print or export.
Print Zoom
Zoom Mode: Set zoom mode for report printing. Three zoom modes are offered – Zoom to paper height, Zero and Zoom to paper width.
Zoom to paper height: Print the report according to paper height.
Zero: Print the report in its original size.
Zoom to paper width: Print the report according to paper width.
The “Print Zoom” applies when report is exported to a Word document.
Horizontal Alignment
Set horizontal alignment mode for printing a report on paper through this item. There are three modes – Center, Left and Right.
Vertical Alignment
Set horizontal alignment mode for printing a report on paper through this item. There are three modes – Center, Top and Bottom.
Switch to “Page Break” tab in “Report Properties” interface to configure page break information for report printing, as shown below:
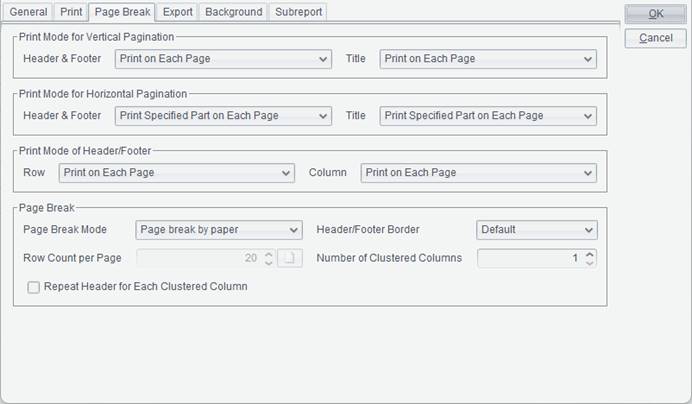
Print Mode for Vertical Pagination
The item is used for setting printing mode of header & footer and title for vertical pagination.
There are two printing modes – “Print on Each Page” and “Print on First Page Only” – for both header & footer and the title.
1. Print on Each Page
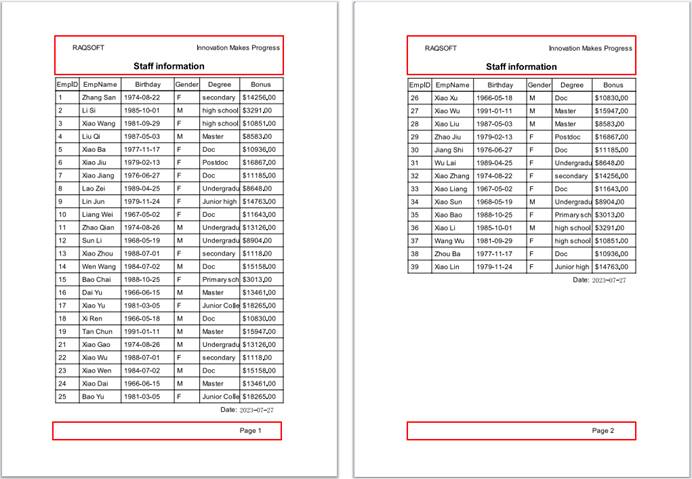
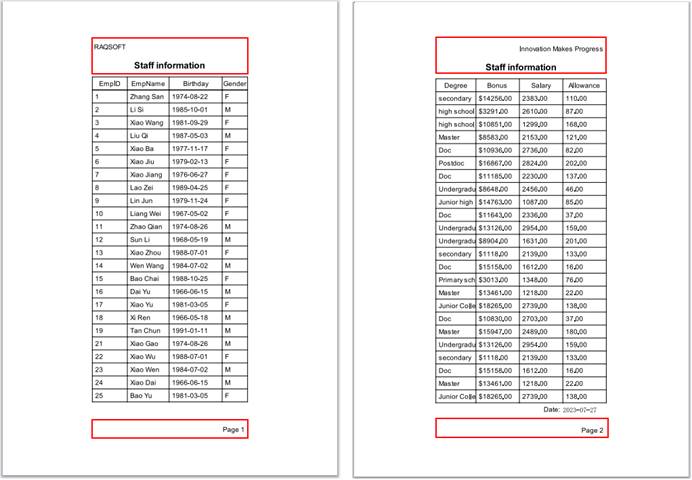
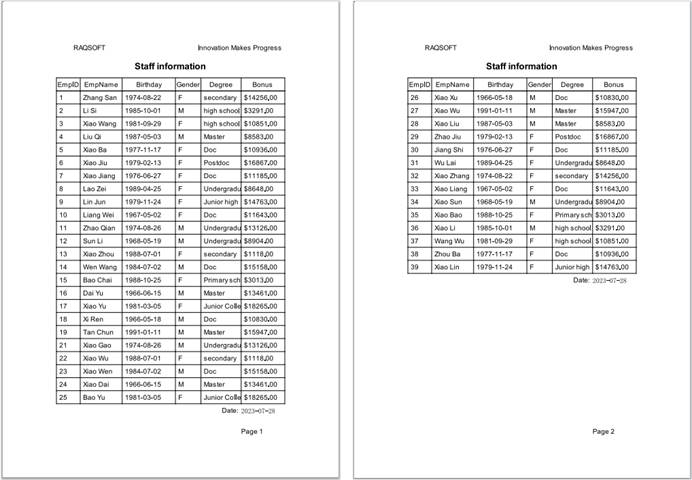
Sometimes people will look up different pages of the same report and those pages are not stored together. In order to let every user know about the report’s header & footer and the title during report lookup, the related information need to be printed on each page. To do this, you just select “Print on Each Page” in both the drop-down list of “Header & Footer” and that of “Title” under “Print Mode for Vertical Pagination”.
The preview shows that header & footer and the title are displayed on both the first page and the second page. The print preview effect is as follows:
2. Print on First Page Only
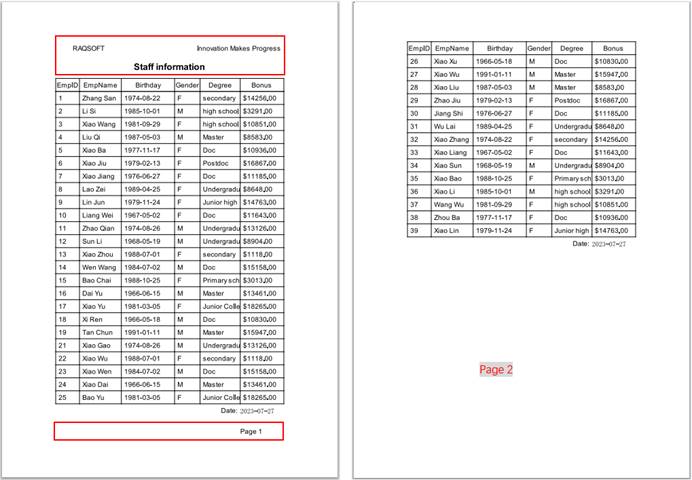
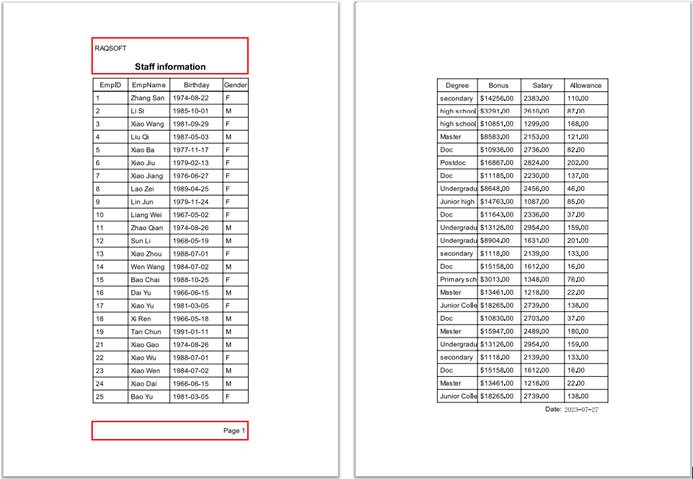
Sometimes you need to bind up the printed report pages and put them away, and just want to print header & footer and the title on the first page. To do this, you just select “Print on First Page Only” in both the drop-down list of “Header & Footer” and that of “Title” under “Print Mode for Vertical Pagination”.
The preview shows that header & footer and the title are displayed on the first page while they are hidden on the second page. The print preview effect is as follows:
Print Mode for Horizontal Pagination
Sometimes one record contains so many fields that the width of a single page cannot accommodate the whole record. In this case, we set horizontal pagination for the report. The “Print Mode for Horizontal Pagination” item is used for setting printing mode of header & footer and title for horizontal pagination.
There are four printing modes – “Print on Each Page”, “Print on First Page Only”, “Print Specified Part on Each Page” and “Print Specified Part on First Page Only” – for both header & footer and the title when a report is paginated horizontally.
1. Print on Each Page
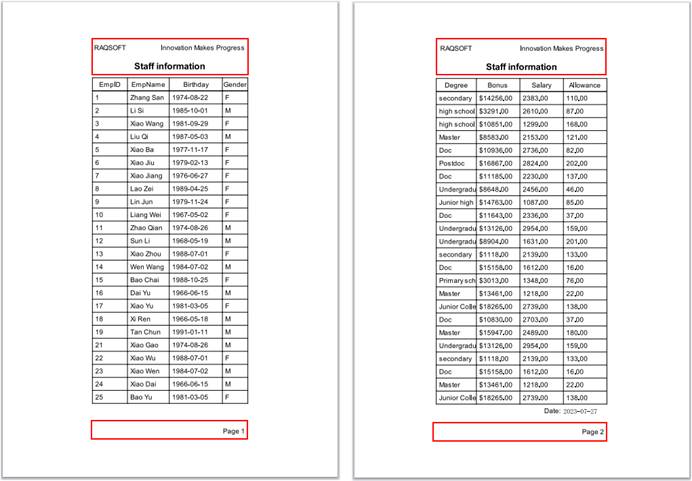
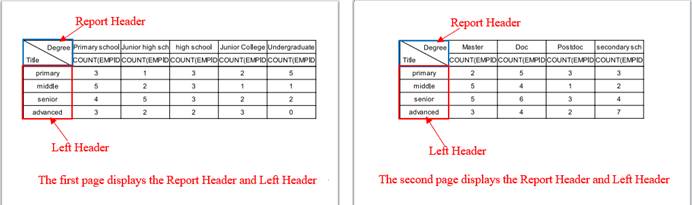
Sometimes a printed horizontally-paginated multi-page report is stored separately and users only look up pages they interested in. In order to enable every user to view the report’s header & footer and title during report lookup, the related information needs to be printed on each page. To do this, you just select “Print on Each Page” in both the drop-down list of “Header & Footer” and that of “Title” under “Print Mode for Horizontal Pagination”. The print preview effect is as follows:
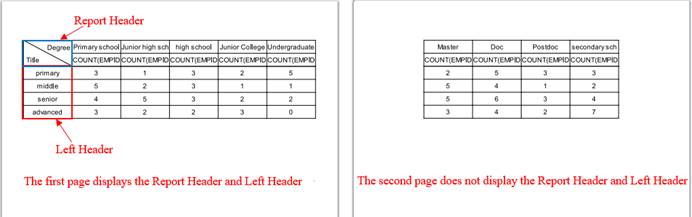
2. Print on First Page Only
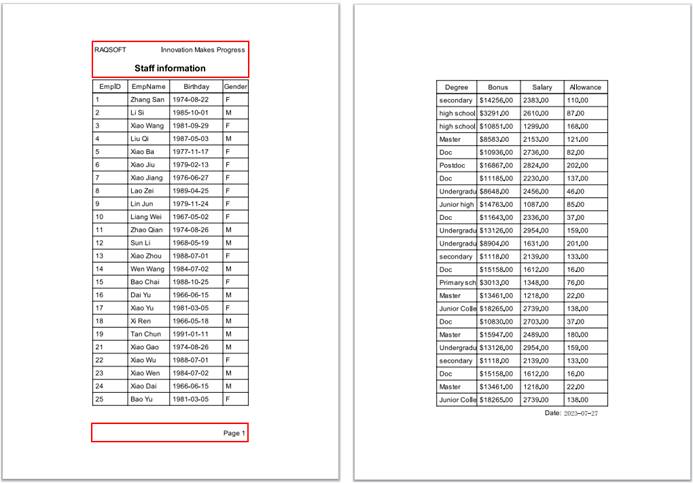
Sometimes a printed horizontally-paginated multi-page report is required to have header & footer and title on the first page without printing them on the other pages. To do this, you just select “Print on First Page Only” in both the drop-down list of “Header & Footer” and that of “Title” under “Print Mode for Horizontal Pagination”. The print preview effect is as follows:
3. Print Specified Part on Each Page
Sometimes users require that a specified part of the header & footer and title be printed on each page for horizontal pagination and pages be pieced together to form the target report. To do this, you just select “Print Specified Part on Each Page” in both the drop-down list of “Header & Footer” and that of “Title” under “Print Mode for Horizontal Pagination”. The print preview effect is as follows:
4. Print Specified Part on First Page Only
Sometimes users require that a specified part of the header & footer and title be printed on the first page only for horizontal pagination while leaving the other pages blank in the corresponding places. To do this, you just select “Print Specified Part on First Page Only” in both the drop-down list of “Header & Footer” and that of “Title” under “Print Mode for Horizontal Pagination”. The print preview effect is as follows:
Print Mode of Header/Footer
This is used for setting up the printing mode for report header and/or footer.
You can set up header/footer print mode on rows and column. For rows, you can set up print mode for both report header and footer. There are two modes in this case – “Print on First Page Only” and “Print on Each Page”. For columns, you can set up print mode for the left header. There are the same two modes in this case, too.
1. Print on First Page Only
Some users require to display header and footer only on the first page while leaving the corresponding places blank on the other pages. For instance, when the report width is greater than paper width, we only need to print header and footer just on the first page instead of all pages. When the whole report is printed, we piece all pages together horizontally and they share header and footer printed on the first page. If we set up “Print on First Page Only” on rows, the report header and footer areas will be printed only on the first page. If we set up the same print mode on columns, the left header will be printed only on the first page.
Set up “Print on First Page Only” for both “Row” and “Column” under “Print Mode of Header/Footer”. The print preview effect is as follows:
2. Print on Each Page
Some users require to display header and footer on every page. To do this, set up “Print on Each Page” for both “Row” and “Column” under “Print Mode of Header/Footer”. The print preview effect is as follows:
Page Break Mode
There are three modes – Page break by paper, Page break by row and No page break.
1. Page break by paper
Choosing “Page break by paper” means that the report will be automatically paginated according to the specified paper size and the part exceeding the size will be printed on the next page. This mode is fit for scenarios where there are no requirements on the number of records printed on a single page. Below is print preview effect:
2. Page break by row
In certain occasions users require to print records of the specified number of rows in a single paper. To do this you can choose “Page break by row”, which enables to paginate the report according to the specified number of data rows on a single page and print the rows exceeding the specified number on the next page. For instance, we set up “Page break by row” for “Page Break Mode” on the “Page Break” tab and type 15 in “Row Count per Page” edit box, and we get the following pagination effect by printing 15 rows on each page:
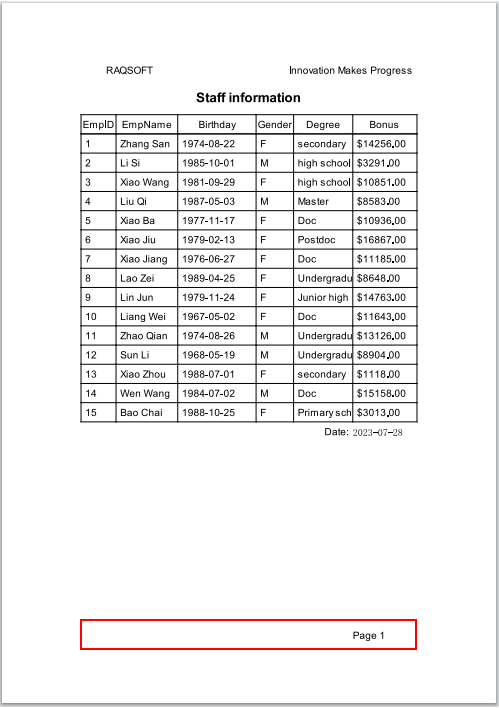
In pagination by row setup, you can specify a fixed number of rows for each page or specify a dynamic number, which is also set up through “Row Count per Page”.
Note: By selecting “Page break by row”, you disable the “Print Zoom” options.
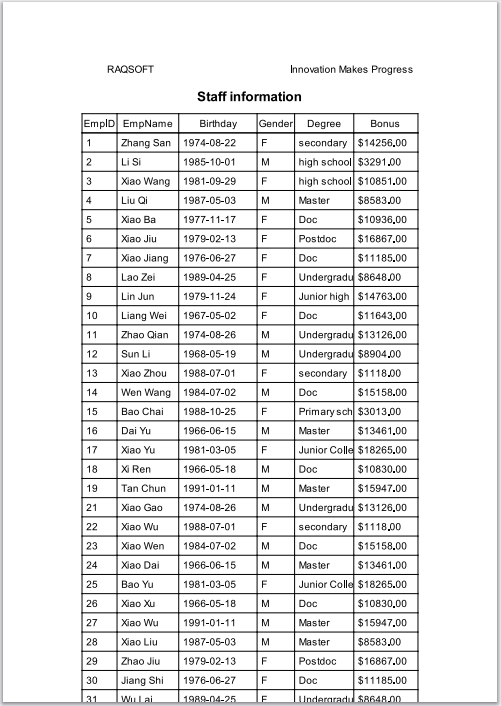
3. No page break
Sometimes for the convenience of viewing, users require to print all information in a report on a single paper. In this case you do not need to paginate the report. Other times when you need to print a report based on an existing template, you scan bills to be printed into images, insert them onto the report design interface and plot the report in the base picture. The report information will be printed together with the base picture, and in order to ensure the target report is not dislocated you should not use the pagination function. In those two cases, you set up “No page break” for “Page Break Mode” on the “Page Break” tab and the print preview effect is as follows:
Header/Footer Border
There are two border types for headers and footers – Default and Custom.
If no line style is specified for the top border of cell directly above the footer, the value you select for “Border of Header/Footer” determines whether or not to use line style of bottom border of the neighboring cell of the cell directly above the footer.
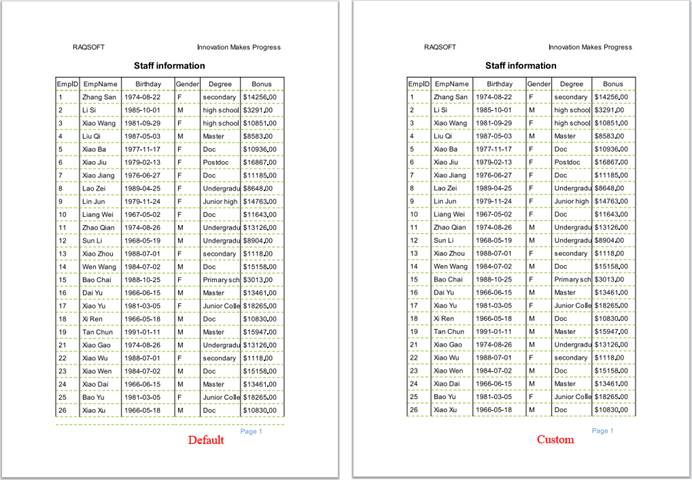
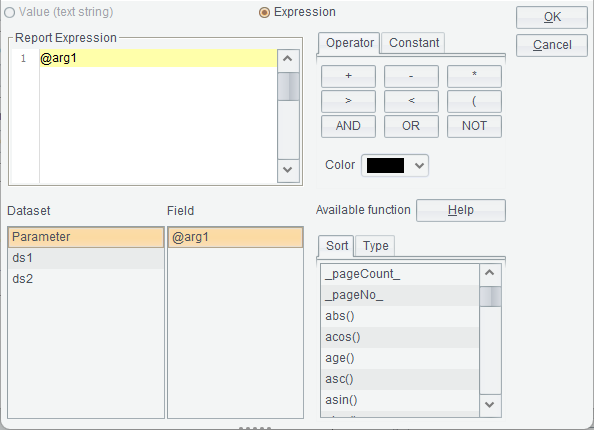
Row Count per Page
If “Page Break Mode” is “Page break by row”, you can set the number of rows displayed in the data area in each page through “Row Count per Page”.
You can specify a fixed
number of rows for each page, or achieve dynamic page break through a
parameter. Click ![]() after “Row Count
per Page” to pop up the Expression Editor dialog, where you can set up parameter
expressions to achieve dynamic page break, as shown below:
after “Row Count
per Page” to pop up the Expression Editor dialog, where you can set up parameter
expressions to achieve dynamic page break, as shown below:

The print preview effect is as follows:
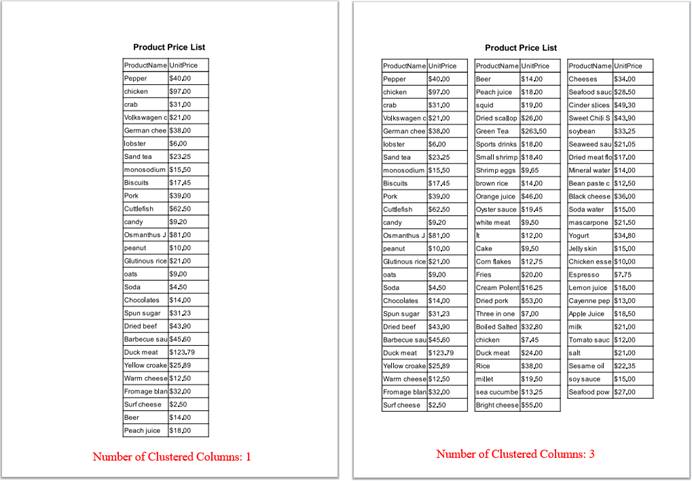
Number of Clustered Columns
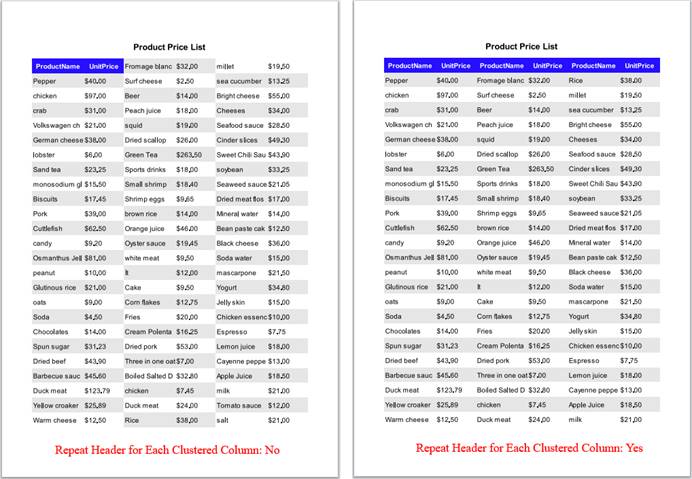
Through this item you can set the default number of horizontally clustered columns in a report at print or export. Often, we have reports that have many rows but only several columns. Such a report is long and narrow, and there will be large white spaces horizontally when it is printed on an A4 paper. This is neither economical nor neat and convenient to view. Displaying the report as horizontal, multiple clustered columns in papers is neat and economical and makes it convenient to look up information. In a report with horizontally clustered columns, the header repeats above each clustered column, but the report title can appear only once.
Let’s set up “Number of Clustered Columns” in “Page Break” tab as 3, and the print preview effect is as follows:
Repeat Header for Each Clustered Column
This is used to set up whether or not to repeat the header for each clustered column.
Switch to “Export” tab on “Report Properties” interface to set up whether or not to export background image and password and privilege when the report is exported as a PDF file or an Excel file, as shown below:
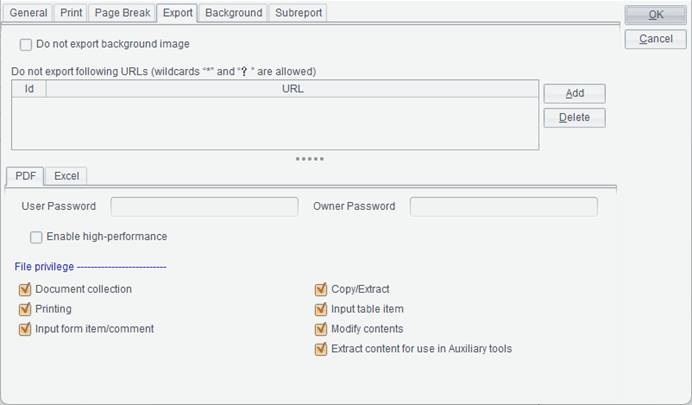
Do not export background image
Set up whether or not to export background image at when exporting a report.
Do not export following URLs
Specify which URLs among hyperlinks in cells of the report won’t be exported. Add a URL by clicking “Add” button and delete a URL from the URL list through “Delete” button.
Set password and privilege of the PDF file to which the report will be exported.
User password: The password users need to enter when viewing the exported PDF file; in this case users can only view the PDF file.
Owner password: The password users need to enter in order to edit the exported PDF file.
File privilege: The user privileges for performing certain operations on the exported PDF file; just check the options to get the corresponding privileges.
Enable high-performance: By checking “Enable high-performance” option for export or in a flash print, the report will be exported in continuous strings rather than character by character. This is fast and the file for storage is relatively small. But there will be a few differences from the original because of the nuances between PDF and JAVA in characters. When this option is not checked, the report will be exported to a PDF file or as an SVG image character by character or coordinates by coordinates. That is slow, but the result coordinates are completely same as the original.
Excel
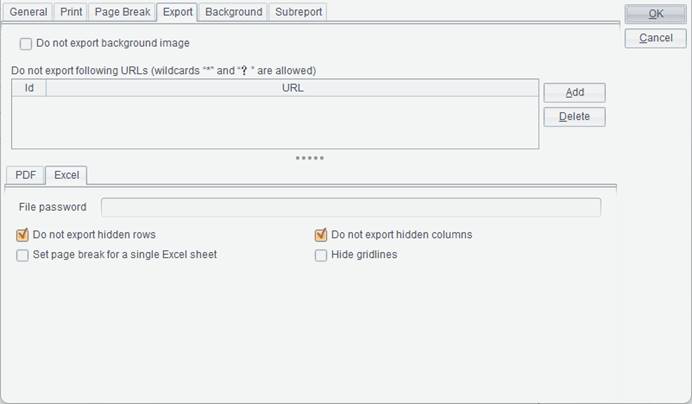
File password: The password you need to enter in order to open the Excel file.
Do not export hidden rows/Do not export hidden columns: Set up whether or not to export the hidden rows or columns.
Set page break for a single Excel sheet: When exporting the report to a single Excel worksheet, set up whether or not to specify the page break according to the way the report is paginated so that the Excel sheet has similar pagination effect.
Hide gridlines: Set up whether or not to hide gridlines in the exported Excel file.
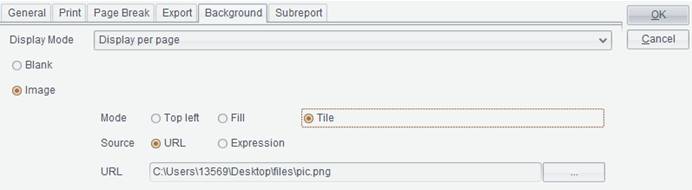
Switch to “Background” tab in “Report Properties” interface to configure background image information for the report. The background image can be an image or a watermark, as shown below:
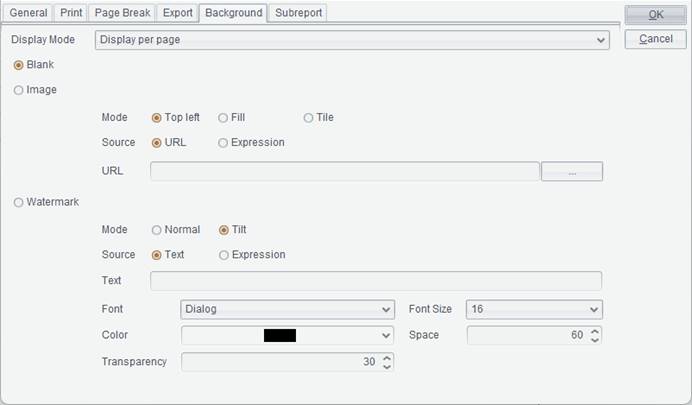
Display Mode
Set display mode of the background image. There are two modes: Display per page and No Display.
Blank
Remove the background image object.
Image
Set Mode, Source and URL of the background image.
Mode: Top left, Fill and Tile.
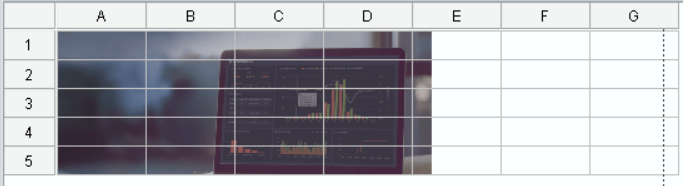
1. Default is Top left. By using this mode, the background image is displayed in its original size starting from the top left corner of the report while leaving the rest of the report area blank and cutting off the extra area. The effect is as follows:
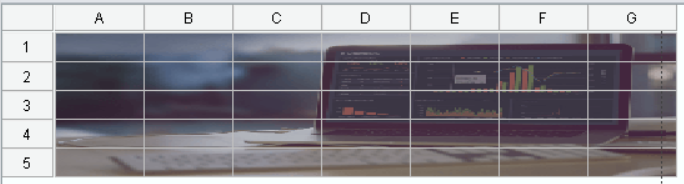
2. With “Fill” mode, the background image is zoomed to the report size. Effect is as follows:
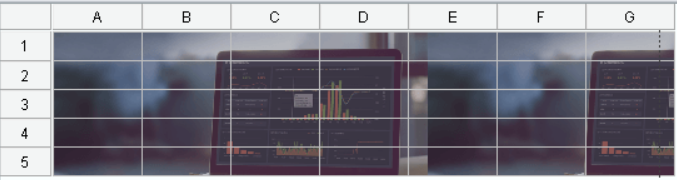
3. The “Tile” mode enables displaying the background image in its original size and automatically copying itself to fill in the whole report. Effect is as follows:
Source: Select type of the background image origin. They are URL and Expression.
For instance: URL
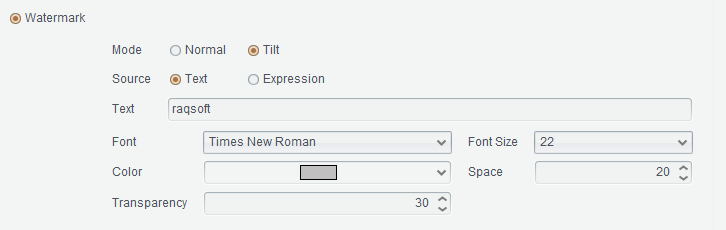
Watermark
On this tab, we can set the watermark’s mode, source, text, font, font size, color, space and transparency.
Mode: Set watermark mode – Normal or Tilt.
Source: Set source of watermark – Text or Expression.
Font: Set font format for watermark.
Font size: Set font size of watermark.
Color: Set watermark color.
Space: Set gap between watermarks.
Transparency: Set degree of transparency for watermark.
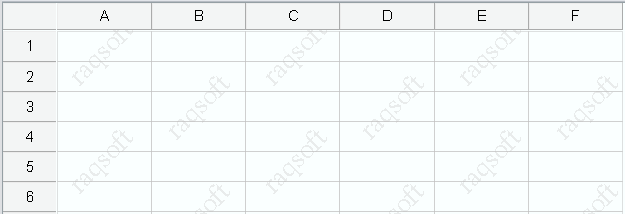
For instance: Text mode
Eeffect is as follows:
Switch to “Subreport” tab on “Report Properties” interface and define subreport to be inserted into the report, as shown below:
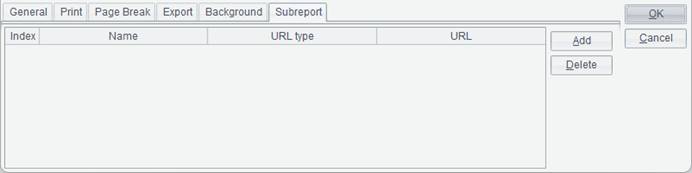
Click “Add” button to automatically add a subreport in the subreport list.
Click “Delete” button to automatically delete from the subreport list a selected subreport.
Name
Define name of the subreport. Use the name to represent the subreport wherever it is used.
URL Type
Set type of the subreport’s URL – Relative path or Absolute path.
1. Relative path
A relative path is relative to【Resource directory】in【Tools】à【Options】à【File】.
A relative path does not need to be preceded by slash “/” while an absolute path needs to be headed by the drive letter or slash “/”. An absolute path led by slash “/” represents one having the root directory of the current drive. /demo means D:/demo when the application’s root directory is D drive.
2. Absolute path
An absolute path is the real path a subreport has on the disk. Select “Absolute path” under “URL Type” column and double-click “URL” edit box to get the following “Open” dialog:
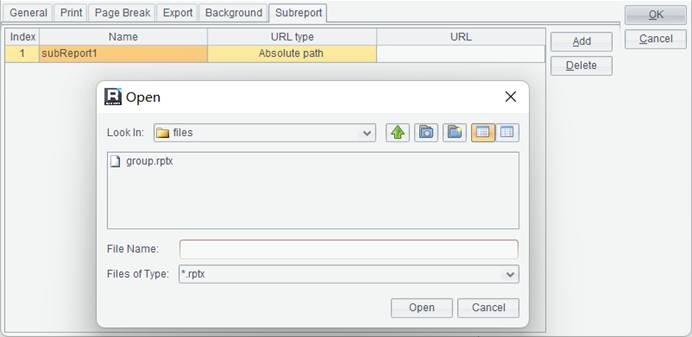
Select location of the subreport and click “Open” button and the subreport’s absolute path will be automatically entered in the “URL” edit box.